
Choosing the right Seawater Membrane is not a simple match between a product sheet and a plant. The real feedwater matters. Salinity, temperature, suspended solids, and seasonal changes all affect performance. A membrane selected for one coast may struggle at another site. Small details count.
Membrane researcher Professor Menachem Elimelech’s work highlights an important principle: desalination choices must account for energy use, not salt rejection alone. This is a paraphrase, not a direct quotation. Strong salt rejection looks impressive, but it does not tell the whole story. Operators should also compare operating pressure, water recovery, fouling risk, cleaning requirements, and expected service life. No membrane is perfect. Even good specifications can hide a poor fit.
This guide presents seven practical considerations for comparing options, from feedwater conditions to supplier support. Look closely at test conditions. A laboratory result may not reflect a warm intake pipe carrying algae after a storm. Ask how performance changes over time, and check whether replacement elements are readily available. These questions are less glamorous. They matter.
There is room for judgment. Two plants with similar water may still need different designs because their energy costs, maintenance teams, and operating goals differ. The best choice is not always the one with the highest initial rejection rate. It is the one that performs reliably under real conditions, with clear trade-offs and evidence behind the claims.
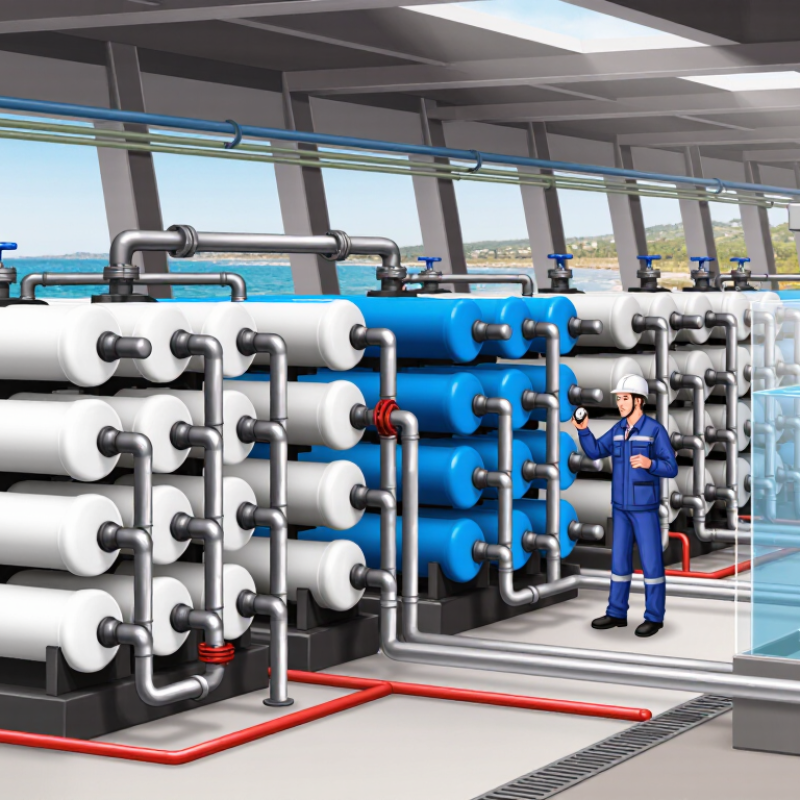
Seawater membranes are designed to separate dissolved salts from water under high pressure. In a typical reverse-osmosis system, the membrane is the selective barrier: water passes through, while most salts and many other dissolved substances remain in the concentrated stream. Thin-film composite membranes are widely used for this work. Their performance depends on feed salinity, water temperature, pressure, and pretreatment—not just the product label. A membrane suited to brackish water may not reject seawater salts effectively. The distinction matters.
Tips: Check the membrane’s stated salt rejection and operating range against your actual feedwater. Review fouling and cleaning guidance, too. Pretreatment is not an optional detail; particles, scale, and chlorine can shorten membrane life. Keep operating records, including pressure, flow, and conductivity. Small changes can be useful warnings.
Membrane choice also affects energy use and recovery, or the share of feedwater converted into product water. Higher recovery can increase scaling risk, so it should be balanced with feed chemistry and system design. A specification sheet may make one option look clearly superior, but real operating conditions can change that picture. I would compare performance data at relevant temperatures and salinities, then verify it during commissioning. Even careful selection cannot replace routine monitoring.
Choosing a seawater membrane starts with the water entering the system, not a product brochure. Measure salinity, temperature, turbidity, and silt density index using representative samples. Check seasonal shifts too; a calm-day sample may hide runoff or algal changes after storms. Small details matter.
High suspended solids can foul membrane surfaces, while higher salinity raises osmotic pressure and may require more feed pressure. Temperature affects permeate flow and salt rejection, so compare actual conditions with the membrane’s stated operating range. If boron matters, test it directly and confirm expected rejection at the planned pH and recovery. Do not infer it from total dissolved solids alone.
Record available pressure, target recovery, daily demand, pretreatment performance, and cleaning limits before sizing. High recovery can concentrate salts and increase scaling risk; antiscalant cannot replace sound feedwater assessment. Leave room for variation. Revisit assumptions using pilot or commissioning data, since projections may not match plant conditions. That estimate may still be wrong.
Salt rejection, water output, and pressure needs should be compared together, not as separate headline figures. A membrane with high salt rejection may produce less water under the same operating conditions. Check the test data for feed salinity, water temperature, and pressure. A result measured with warm, lower-salinity water may not predict performance on a cold day offshore.
Look at permeate flow as well as rejection. For example, a system producing too little water may force longer pump runs, even if its product water is very low in salt. Compare figures at the recovery rate you expect to use. Small details matter. Scaling, fouling, and changing feed conditions can reduce output over time, so a laboratory rating is not a promise of steady field performance. I would not choose from one catalog number alone; that shortcut can mislead.
Pressure requirements affect energy use and equipment sizing. Higher pressure can increase water production, but it also raises pump demand and places more stress on seals and plumbing. Confirm the membrane’s recommended operating range, then check that the pump can maintain it under real feed conditions. Leave room for pressure losses in hoses and filters. It is easy to overlook those. A modest output target with reliable pressure control may be more practical than chasing maximum production.
| Tip | What to Compare | Practical Benchmark | How to Choose |
|---|---|---|---|
| 1. Salt rejection | Rated NaCl rejection and expected permeate salinity | Many seawater RO elements report approximately 99.7%–99.8% rejection under specified test conditions. | Compare rejection figures only when test salinity, pressure, temperature, and recovery are comparable. Higher rejection can help meet product-water targets, but does not guarantee a specific output-water quality in every system. |
| 2. Water output | Permeate flow at the intended feed conditions | A preliminary seawater RO design flux is often around 12–18 L/m²·h; the suitable value depends on feed quality and plant design. | Check output at your actual salinity and temperature, not just the highest catalogue flow. Allow for seasonal changes and performance decline over time. |
| 3. Pressure needs | Operating pressure, pump capacity, and energy demand | Seawater RO systems commonly operate at roughly 55–70 bar (about 800–1,015 psi), depending on feed conditions and recovery. | Confirm the membrane can meet the required flow at the pressure your pump can supply. Colder water, higher salinity, or higher recovery can increase pressure requirements. |
| 4. Feed-water salinity | Total dissolved solids (TDS) and changes in source-water salinity | Open-ocean seawater is commonly near 35,000 mg/L TDS, though actual coastal and brackish-influenced sources vary. | Use a current feed-water analysis and account for seasonal variation. Do not assume a membrane’s rated flow at one salinity will hold at a higher site salinity. |
| 5. System recovery | Permeate produced relative to feed flow, and the resulting concentrate salinity | A preliminary single-pass seawater RO design may use about 35%–45% recovery; the appropriate target is site- and system-dependent. | Balance water yield against scaling risk, concentrate management, and pressure demand. Set recovery from water analysis and system design rather than maximizing it by default. |
| 6. Pretreatment and fouling risk | Suspended solids, turbidity, and silt density index (SDI) | An SDI₁₅ target below 3 is commonly used for RO feed pretreatment; the membrane supplier’s limits and project specifications should also be checked. | Choose the membrane as part of a complete pretreatment plan. Poor feed-water conditioning can reduce output and increase cleaning frequency regardless of the membrane’s rated rejection. |
| 7. Test conditions and normalization | How performance was measured and corrected for operating conditions | Published seawater RO test data may use conditions around 32,000 mg/L NaCl, 25°C, and 55 bar, but protocols differ between products and manufacturers. | Compare flow and rejection using the same feed concentration, temperature, pressure, and recovery wherever possible. Review normalized performance data and confirm the element fits the system’s pressure vessel. |
Benchmarks are general planning references, not guaranteed membrane performance. Actual results depend on feed-water composition, temperature, system configuration, pretreatment, and operating conditions.
Tip 1: Match membrane chemistry to the feed. Polyamide elements can be damaged by free chlorine, so check oxidant limits and dechlorination controls.
Tip 2: Check compatibility with salinity, temperature, and cleaning chemicals.
Tip 3: Ask for documented limits, not broad claims. Small mismatches matter.
Tip 4: Evaluate fouling resistance alongside pretreatment. ASTM D4189 provides a method for measuring silt density index; many seawater RO designs target an SDI15 below 3, subject to system requirements.
Tip 5: Review feed-water trends, including turbidity and organic matter. A global inventory by Jones et al. estimated 15,906 desalination plants produced 95.37 million cubic metres daily (Science of the Total Environment, 2019). That scale highlights why reliable pretreatment and monitoring matter.
Tip 6: Protect lifespan with routine checks of normalized flow, salt passage, and pressure drop. Set cleaning triggers for the actual site; one universal threshold can mislead.
Tip 7: Compare warranty terms, replacement assumptions, and cleaning records. A caveat: predicted service life is only a planning estimate. Feed conditions change, and records are sometimes incomplete. Worth checking.
Tip 1: Match the membrane to actual feed conditions, not ideal test water. Record salinity, temperature, pressure, and seasonal changes at the intake. A cold morning can reduce output, while higher salinity may increase pressure demand. Check the membrane’s operating range against the pump, pressure vessel, and target recovery. Small details matter.
Tip 2: Assess pretreatment and cleaning access before comparing performance figures. Ask how often operators need to inspect cartridge filters, track pressure differences, and clean the membrane. Seawater can bring changing levels of organic matter and suspended solids. Consider whether the system allows practical cleaning and straightforward access. Keep records.
Tip 3: Compare lifetime cost, not purchase price alone. Estimate energy use at expected pressure, pretreatment supplies, cleaning labor, replacement intervals, and production lost during maintenance. Request performance data from conditions close to your own. A spreadsheet helps, but its assumptions may be wrong; check them against operating logs or an experienced engineer’s assessment.
Please enter the details to download, thank you
Get in Touch With Us
Please enter the details to download, thank you