
A clear reading can protect a process from costly guesswork. Yet choosing a Turbidity Sensor is not just a matter of comparing price tags or display screens. A sensor that performs well in clean water may struggle when suspended particles change in size, color, or concentration. Bubbles, fouling, and poor installation can also distort readings. Small details matter.
Water-treatment researcher James K. Edzwald has written extensively about water quality and treatment. A practical paraphrase of his work is: “Measurement choices should fit the water and the treatment goal.” This is a paraphrase, not a verified verbatim quotation. That distinction matters; technical advice should not rely on invented quotes. For buyers, the principle is useful. Check the measurement method, expected range, response time, calibration needs, and compatibility with the process. Then consider the real operating setting: a narrow pipe, a sunlit outdoor channel, or a sample line that collects sediment. A specification sheet cannot reveal every maintenance headache.
The right choice depends on your application. No sensor is perfect. Some models simplify routine checks, while others offer stronger control-system integration or better performance in difficult samples. These seven tips will help compare those trade-offs, ask suppliers sharper questions, and avoid decisions based on one attractive feature. A little skepticism helps. So does a clear record of how the sensor behaves after installation.
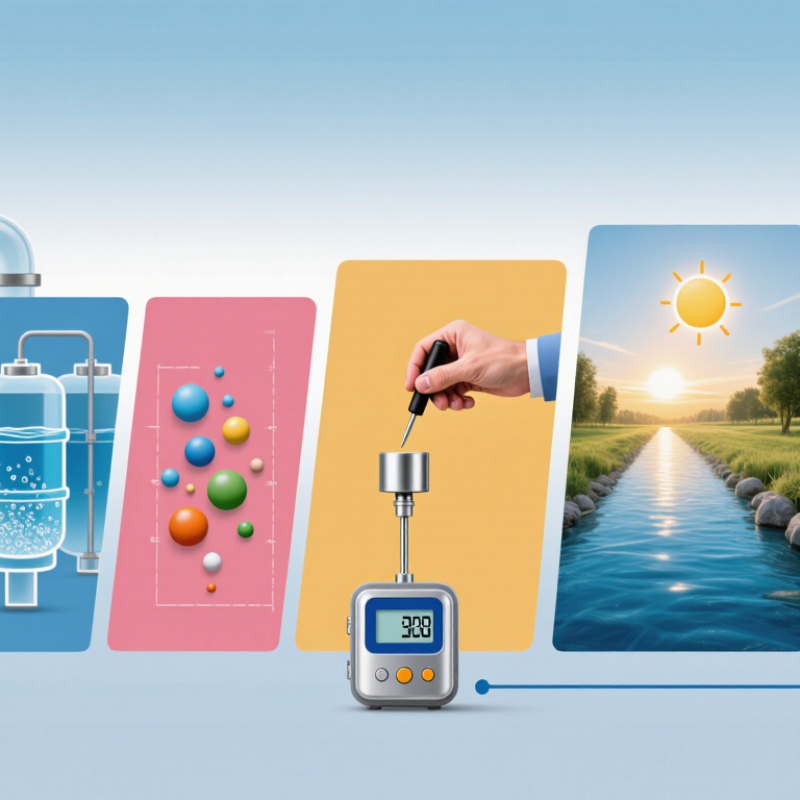
Before choosing a turbidity sensor, describe the water you need to monitor. Drinking water, wastewater, and river water can behave very differently. Note typical and peak turbidity, expected particle types, and whether readings change quickly after rain or during production. A reading from pale mineral sediment may differ from one affected by algae or dark particles. Turbidity is useful, but it does not identify contaminants or replace other water tests.
Small details matter. Choose a measurement range that covers ordinary conditions without losing useful detail during spikes. Decide how often readings are needed and whether staff can access the sensor for cleaning and checks. In a pipe, consider flow, bubbles, and installation position; in a river, avoid stagnant edges and sediment stirred up by the mounting hardware. Calibration should suit the expected range, and records should include maintenance and unusual conditions. Not always easy. A sensor that works well in a clean test sample may need more frequent attention in real water. Check the site, review early readings, and adjust the monitoring plan when the data do not match what operators observe.
7 Tips for Choosing the Best Turbidity Sensor
Tip: Start with the expected range, not the instrument’s maximum. A drinking-water filter outlet may need to resolve changes below 1 NTU, while a muddy intake can quickly exceed that range. The U.S. EPA’s Surface Water Treatment Rules set a benchmark for conventional filtration: combined filter effluent must be at or below 0.3 NTU in at least 95% of monthly measurements, and never above 1 NTU. These limits are not universal sensor specifications, but they show why low-end resolution matters. A sensor that reads well only at high turbidity may miss a meaningful filter change. Tiny shifts count.
Tip: Match the optical method to the sample. ISO 7027-1 describes nephelometric measurement for low turbidity and attenuation methods suited to higher levels. Suspended particles differ in size and color, so two methods may not report identical values on the same sample. Check which units and method your process requires. Then test the sensor against representative water, not just a clean calibration standard. Bubbles, deposits, and scratched optics can distort readings; even careful setups are imperfect. For a channel with fast flow, inspect mounting and cleaning needs before choosing a probe. A practical range should cover normal readings and short spikes without sacrificing useful detail.
Environmental compatibility starts with the water itself. Check its temperature range, pH, salinity, and cleaning chemicals against the sensor’s specifications. A housing that suits fresh water may not tolerate a corrosive process stream. Optical windows also need materials that resist scratching and chemical exposure.
Think about what is suspended in the sample. Fine clay, algae, and larger particles can scatter light differently, so the sensor’s measurement range should match expected conditions. Fouling can gradually cloud the optical surface. Small details matter. In a pilot test, inspect the window after several operating days, not just immediately after installation.
Installation affects readings as much as sensor choice. Place the sensing area in representative flow, away from stagnant corners, dosing points, and sediment traps. Avoid spots where air bubbles collect; bubbles can cause unstable readings. In open channels, check that the sensor stays submerged during low flow. In pipes, follow the specified orientation and keep enough clearance for cleaning and removal. Leave room for calibration access. A tidy mount is helpful, but it does not guarantee a representative sample. Real flow patterns can be awkward, and a short field check may reveal a placement problem that drawings missed.
A turbidity sensor’s accuracy should be judged against the readings your process actually needs, not just its best-case specification. EPA Method 180.1 (1993) gives a direct measurement range of 0–40 NTU; samples above that range require dilution. This is a useful reminder that one instrument may not suit every site. Compare readings with a traceable reference standard at low, middle, and high points in your operating range. Small differences matter. Check repeatability too: a sensor that returns different values after repeated measurements can complicate treatment decisions, even when its stated accuracy looks impressive.
Calibration needs depend on the optical design, water matrix, and maintenance conditions. The USGS guide by Wagner and colleagues (2006) describes routine inspection, cleaning, and calibration as part of continuous water-quality monitoring. Build those tasks into the schedule, and record standard values, cleaning dates, and any adjustment. Long-term stability is harder to assess from a single test. Track drift over weeks, especially after changes in flow or sediment load. A fouled window can shift readings before an alarm makes the problem obvious. Field reality is messier. Some sites need frequent checks; others do not, and a fixed interval may be wrong. Compare sensor records with laboratory or reference measurements before extending calibration intervals.
Example turbidity levels to consider when comparing sensor range and calibration needs
The example levels are expressed in NTU and span several orders of magnitude. Choose calibration standards that cover the expected sample range, and check each sensor’s stated accuracy, calibration procedure, and long-term drift under your operating conditions. These levels are illustrative, not a universal calibration schedule.
A turbidity sensor should fit the treatment process, not just the pipe. Tip 1: Confirm the measuring range and response time against real operating conditions, including sudden rises after filter backwashing. Tip 2: Check output compatibility with the plant’s control system, data logger, and alarm settings before ordering. The U.S. EPA’s 2023 Drinking Water Infrastructure Needs Survey and Assessment estimated $625 billion in drinking-water infrastructure needs over 20 years. That figure is not sensor-specific, but it shows why equipment choices must fit wider asset plans.
Tip 3: Ask how often the optical window needs cleaning and whether staff can reach it safely. Tip 4: Review calibration steps, consumables, and service requirements. A sensor that is cheap to buy may demand frequent cleaning in a solids-heavy line. Small details matter. Tip 5: Confirm that readings can be checked against grab samples and documented procedures; field conditions can expose gaps that a specification sheet misses.
Tip 6: Compare total ownership costs over the expected service life, including installation, integration, calibration, cleaning, downtime, and replacement parts. Tip 7: Request a trial using the actual sample stream, if practical. Record labor time and drift, not only initial readings. Estimates can be imperfect, and they should be revisited after commissioning. Check twice.
| Tip | Evaluation dimension | What to verify | Practical selection guidance | Why it matters |
|---|---|---|---|---|
| 1. Match the measurement range | Range, resolution, and expected sample conditions | Identify the normal operating range, likely peaks, required resolution, and whether readings are reported in NTU or FNU. | Choose a sensor whose specified range covers both routine values and credible process excursions. Check its performance specifications at the turbidity levels that matter to your process. | A range that is too broad may not provide the useful resolution needed at low levels; a range that is too narrow may saturate during high-turbidity events. |
| 2. Check the measurement principle | Optical method and applicable measurement standard | Review the sensor’s optical geometry, light source, measurement angle, and stated conformity to the relevant method or standard. | For low-turbidity water, compare instruments designed for nephelometric measurement. ISO 7027 methods commonly use near-infrared light around 860 nm; confirm the exact method and reporting units required by your application. | Particle size, color, bubbles, and optical design can affect readings. Results from different methods or instrument designs may not be directly interchangeable. |
| 3. Evaluate system integration | Outputs, communications, power, and control-system compatibility | Confirm supported outputs and protocols, signal scaling, alarm behavior, supply requirements, wiring, and compatibility with the PLC, SCADA, or data logger. | Verify the specific interface needed at the installation point, such as 4–20 mA or a supported digital protocol. Check whether configuration or interface hardware is required. | Compatibility checks reduce additional hardware, commissioning effort, and the risk of missing or incorrectly scaled process data. |
| 4. Select the right installation arrangement | In-line, immersion, or sample-flow installation | Assess pipe or tank geometry, flow conditions, access, sample representativeness, pressure and temperature limits, and the risk of bubbles or settling solids. | Choose a mounting arrangement suited to the process. For sample-flow installations, provide a representative, stable sample and follow the sensor’s specified flow and installation requirements. | Poor placement or unrepresentative sampling can cause unstable or misleading readings, even when the sensor itself is functioning correctly. |
| 5. Plan for fouling and cleaning | Maintenance access, deposits, and cleaning method | Consider the tendency of the process to cause biological growth, scale, sediment, or oil films, and check how optical surfaces can be inspected and cleaned. | Compare manual cleaning requirements with available automatic cleaning options. Confirm cleaning intervals and materials are appropriate for the process and sensor. | Deposits on optical surfaces can cause measurement drift or interruptions. Cleaning needs affect uptime, labor, and ongoing operating effort. |
| 6. Define calibration and verification needs | Calibration procedure, standards, and traceability | Review the recommended calibration and verification procedure, required standards, frequency guidance, and documentation available for quality records. | Use the calibration materials and procedures specified for the selected measurement method. Establish a verification schedule based on process risk, observed drift, and applicable requirements. | Consistent verification helps identify drift and supports reliable records. Standards and procedures should be suitable for the instrument and the intended measurement. |
| 7. Compare total cost of ownership | Purchase, installation, operation, and lifecycle costs | Include the sensor and accessories, mounting and wiring, integration, commissioning, cleaning, calibration materials, labor, downtime, and replacement parts. | Compare expected costs over the planned service period rather than purchase price alone. Use site-specific maintenance frequency, labor rates, and downtime assumptions. | A lower initial price may not result in a lower lifecycle cost if installation, maintenance, consumables, or service interruptions are more demanding. |
Please enter the details to download, thank you
Get in Touch With Us
Please enter the details to download, thank you